LinkerD is historically the first service mesh created in 2016. The company Buoyant then donated it to CNCF in 2017. It aims to be easier to use than other service meshes, without losing essential functionality.
It’s worth noting that starting from version 2.0, LinkerD was rewritten in Rust to be lighter and more efficient than the initial version. Its operation is based on injecting a sidecar proxy developed by LinkerD, unlike other service meshes that use an existing proxy like Envoy, for example.
This article is part of our series on major players in the service mesh market. We will follow the same structure for this series to help you easily compare the advantages of one service mesh to another.
Helm, which will allow you, through the provided chart, to install and finely configure your service mesh.
In this installation documentation, you can find different important sections based on the distribution used. Additional steps are required, and specific documentation is available for each.
You will notice that we are using a configuration that will allow us to easily install an ingress controller later, following the KinD documentation. This will serve us later in exploring LinkerD‘s features.
Once our cluster is created, we can proceed with the installation of the control plane for our service mesh. For this, we will use the client, following the Get Started documentation, which explains the easy installation case:
curl --proto '=https' --tlsv1.2 -sSfL https://run.linkerd.io/install | sh
export PATH=$PATH:$HOME/.linkerd2/bin
linkerd version
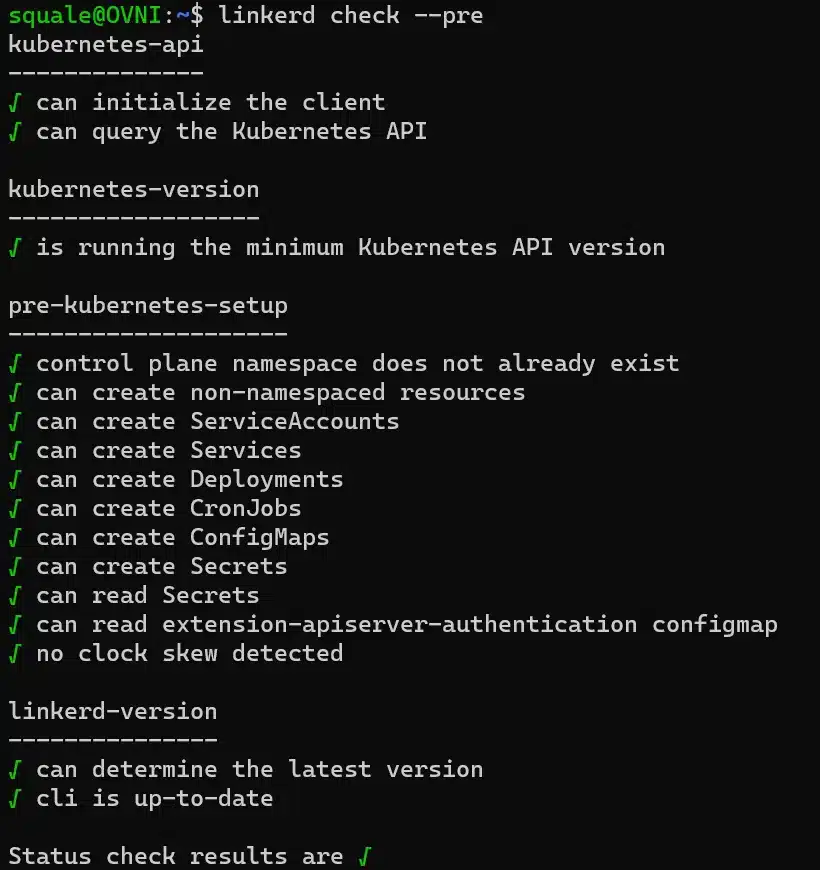
Let’s start by checking our cluster compatibility:
linkerd check --pre
Then we install our service Mesh, by installing the crds and then the controlplane :
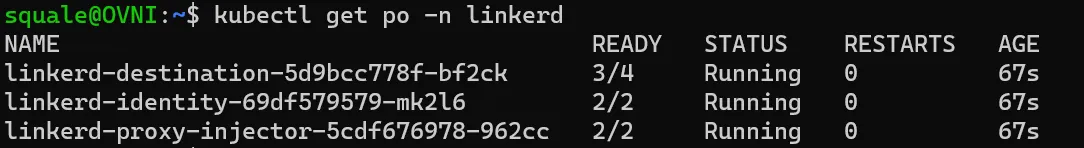
The linkerd namespace has been specifically created for the control plane, and we can see 3 pods into it:
We can check our installation through the cli tool:
linkerd check
The installation takes just a few minutes to set up LinkerD on our cluster. It goes without saying that depending on our requirements, especially if we are no longer in the proof-of-concept phase, we will need to at least change our profile or choose an installation method that is more suitable for our needs, based on the customizations we want to make to our LinkerD deployment.
Later on, we will explore various interesting extensions for our service mesh, as well as different dashboards.
However, we will go ahead and install the extension responsible for dashboarding now, as it also allows us to verify the proper implementation of certain features.
linkerd viz install | kubectl apply -f -
This will create a dedicated namespace with the mantatory components for the viz extension.
Uninstall
Uninstallation can be done easily by using the cli:
linkerd uninstall | kubectl delete -f -
With this command, crds are deleted too.
Examples
LinkerD provides a sample application that serves as a reference point in the documentation, used for various illustrations of the functionalities offered by LinkerD. emojivoto. It is a very simple application that allows users to vote for their favorite emoji and view the existing votes.
However, the same application is not used consistently throughout the documentation. This inconsistency forces us to install additional applications to test different features, and so the concept of a common thread is lost.
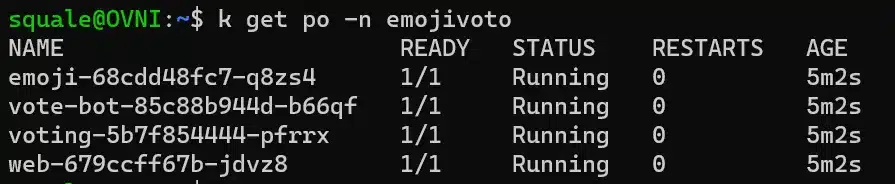
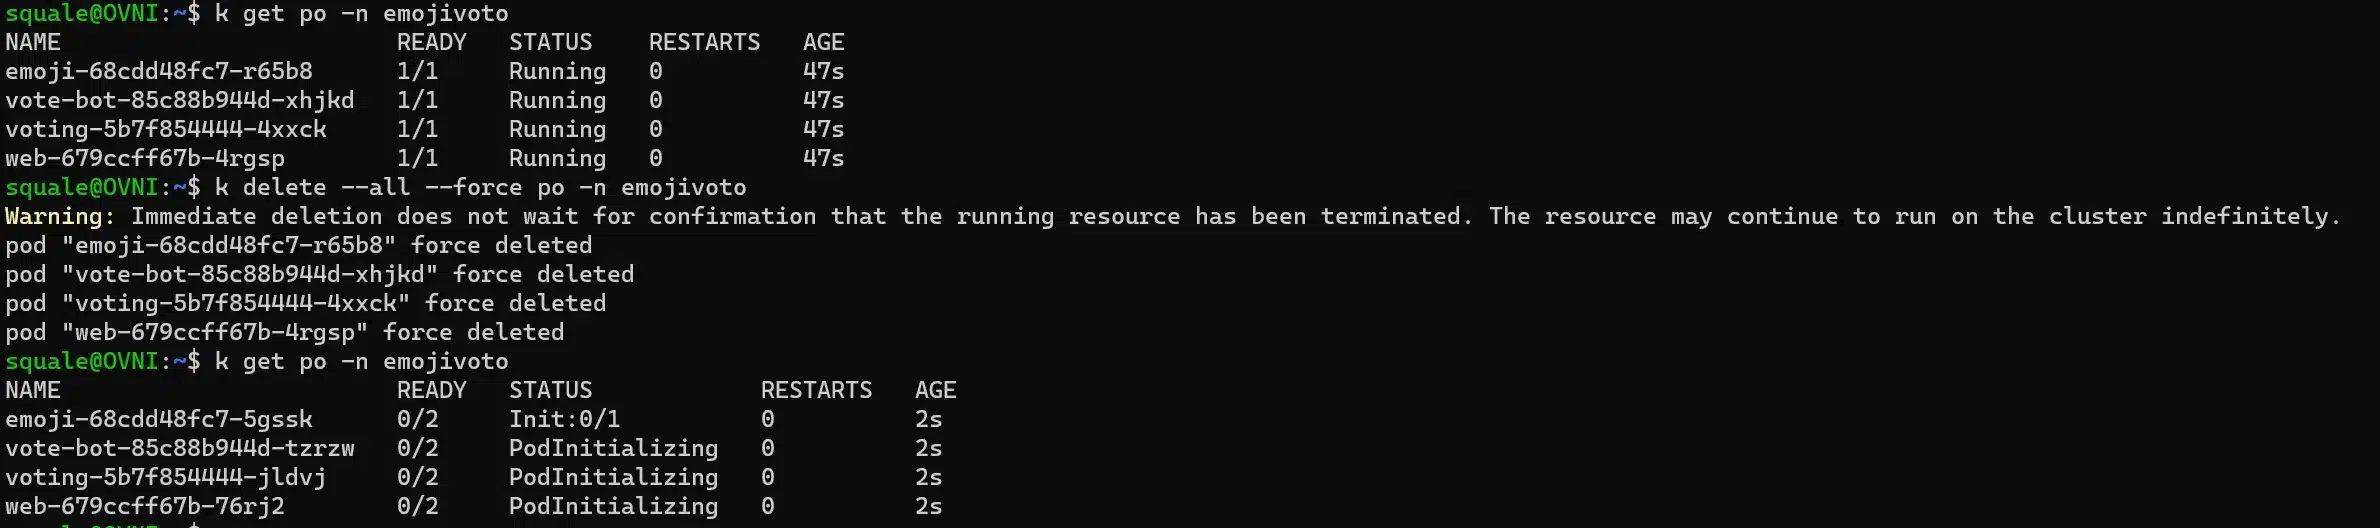
If we analyze our pods in the emojivoto namespace, we can see that the sidecar container is not present (indicating a single container per pod, meaning the proxies have not been injected):
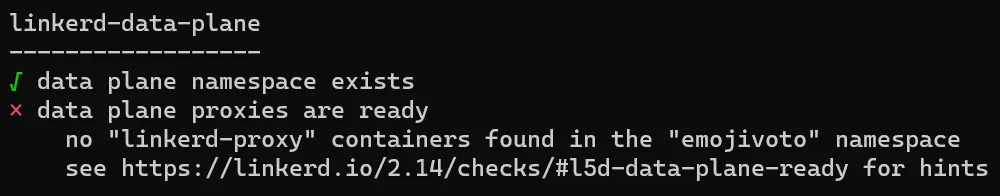
If we execute the check command to verify the state of the injection in the data plane, we indeed notice that something is missing.
linkerd -n emojivoto check --proxy --wait 10s
We recommend using the –wait flag with a relatively small value; otherwise, the default is set to 5 minutes, causing a long wait for a result in case of failure.
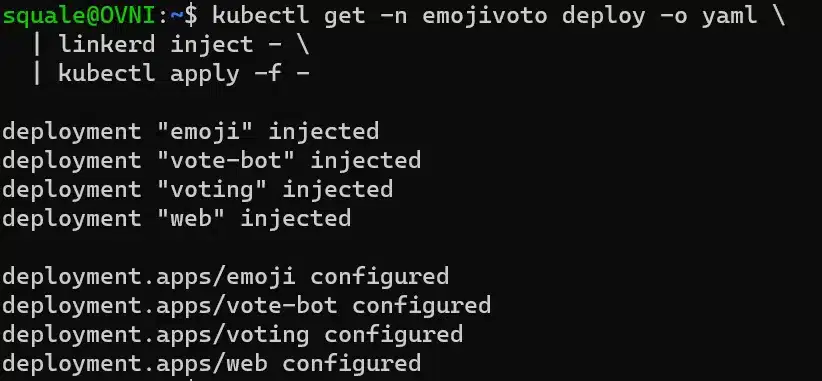
You can see a link in the command output to the documentation about how to inject sidecar containers (linkerd inject).
By doing this, we need to restart pods, because there’s no change at the deployment level. Once our pods have been restarted, we can see our sidecar containers:
We can also do the same thing thaz the cli tool does, which is to push an annotation linkerd.io/inject: enabled, either on the deployments or on the namespace. Ideally, this annotation should be pushed right from the creation of the namespace to ensure that every pod created in the namespace contains the sidecar proxy. This is, of course, the recommendation of SoKube, especially when moving towards GitOps deployments.
The previous check commanf will then confirm that the configuration is correct for the emojivoto namesoace (linkerd -n emojivoto check --proxy --wait 10s).
Completness and clearness of the documentation
The documentation is comprehensive and includes the following sections:
Overview: A simple overview of LinkerD concepts.
Getting Started: Quick setup of the service mesh to get started.
Features: Presentation of various functionalities offered.
Tasks: Different guides and practical examples of how to implement these features.
References: Service mesh architecture and concepts.
FAQ: A list of commonly encountered issues and their resolutions.
Each of these sections contains numerous subsections. However, we find it a bit confusing that the different sections are not grouped under subcategories (such as "Networking" or "Routing").
Encryption of communication
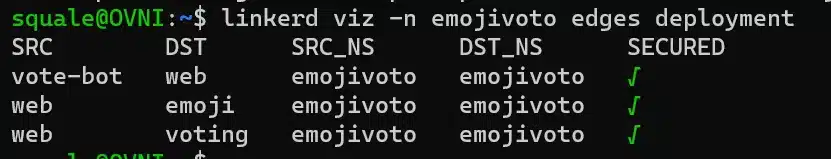
The mTLS encryption between services is automatically enabled with the sidecar proxies, and you can check them with the viz extetntion for emojivoto:
linkerd viz -n emojivoto edges deployment
Note that it is the Identity service that is responsible for generating SSL certificates when a proxy requests them (see Architecture). It is possible to provide the root certificate authority by following this documentation.
In the latest releases, we can’t make mTLS optional. This can be painful if we are in a migration phase, therefore we will note this lack of flexibility as a point that is not critical but slightly negative when adopting this service mesh.
Network observability
By using the viz extension we can navigate to the LinkerD dashboard:
linkerd viz dashboard
We are redirected to the dashboard by namespace, allowing us to quickly assess the overall health of our applications through HTTP and TCP metrics.
If we click on a namespace where the mesh is active (for instance emojivoto), we enter its detailed view. Here, we can analyze more closely the errors that may occur at the level of:
the deployment
the pod
the replica set
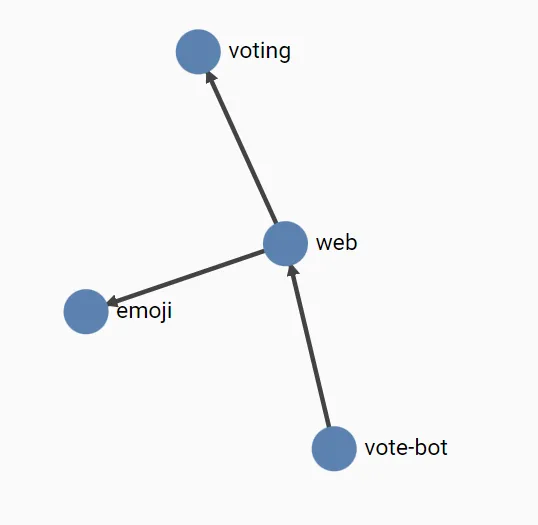
This view shows us the graphical vizualisation of communication between our components:
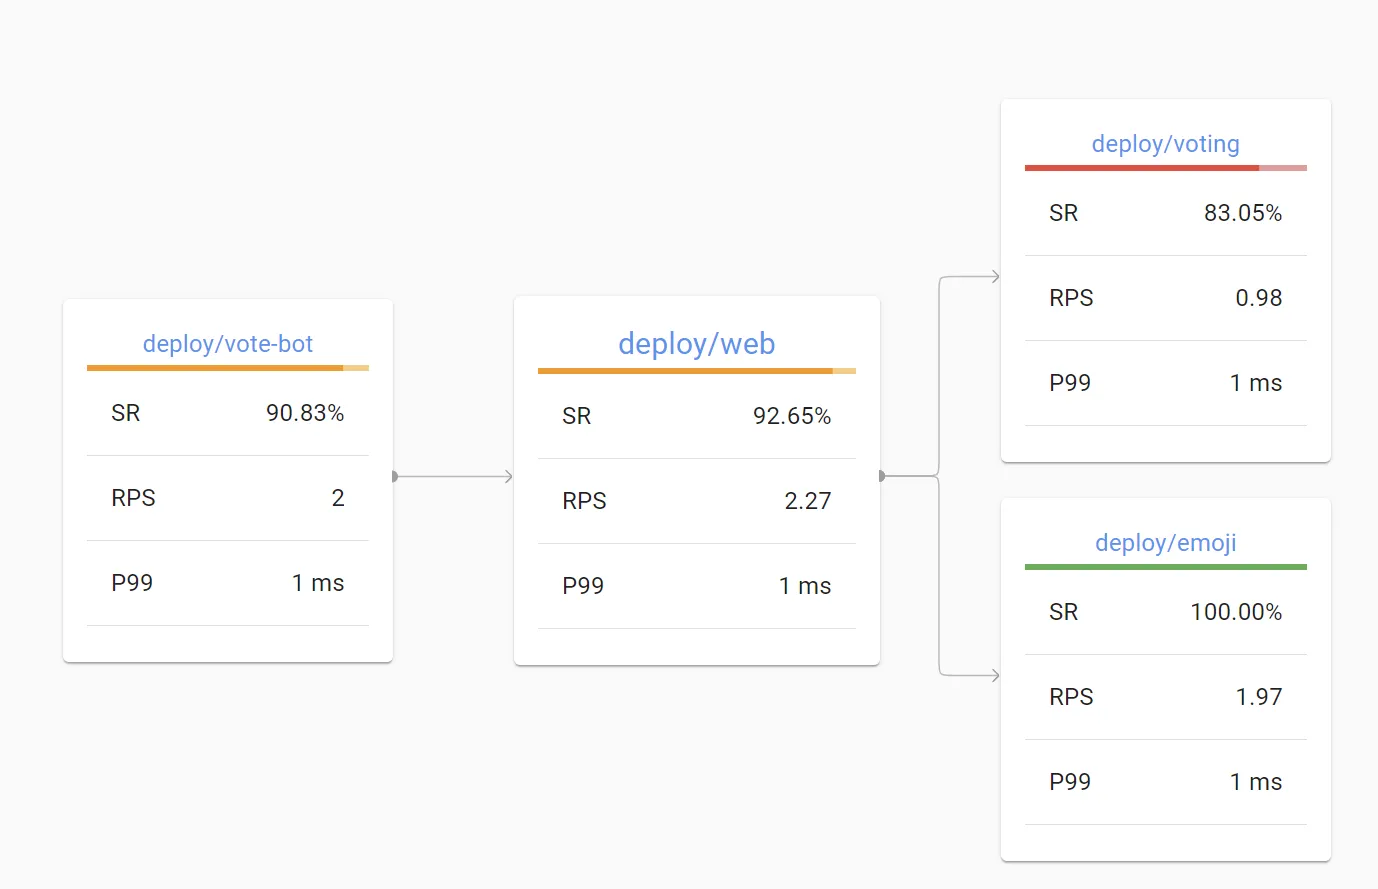
We can follow the links to have more detail on each object, for instance on the deployment web which has some failures.
We can vizualise what our deployment calls and which other components call our deployment:
Here, we can see the Success Rate (SR), the number of requests per second (RPS), and the 99th percentile of latency (P99).
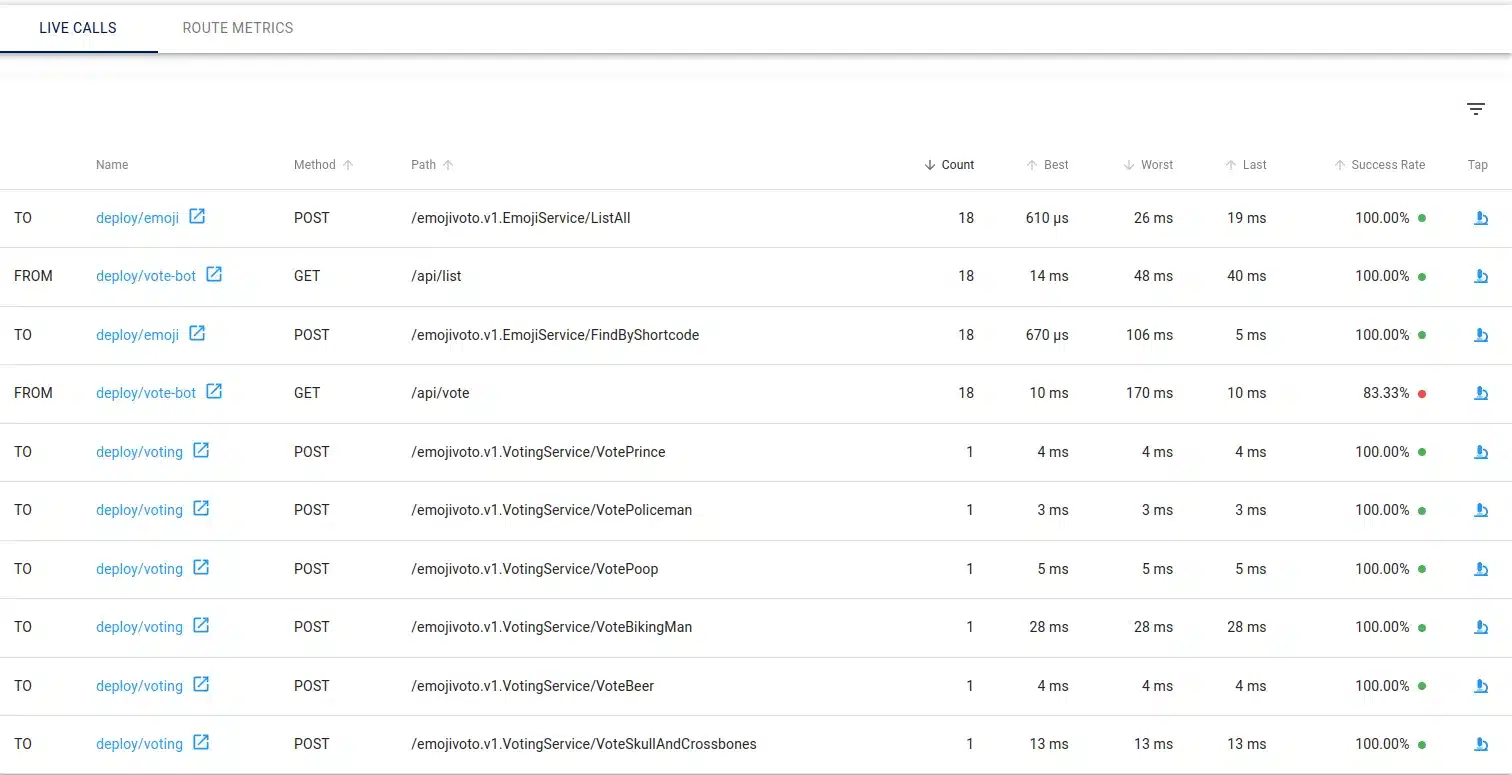
We can also find the live traffic, with the count of requests and their way (inbound or outbound):
Finally, we see into the detail view the success rate of inbound calls, outbound calls, the encryption status of the communication, in a blink.
We can notice that we can see the routes that callers use to access to our deployment (in our case web-svc is used by other deployment to call the frontend); and the route our component calls.
We can switch namespace directly in the left pane, and see the various object in selected namespaces in the same pane.
LinkerD offers you an easy tooling for live analysis:
tap the traffic on a specific object within a given namespace (or even the entire namespace if needed). The main purpose of this tool is to debug and analyze your traffic flows.
top allows you to analyze real-time traffic, but with the aim of detecting resources experiencing high traffic volumes.
route allows you to retrieve performance data related to a route, primarily used to detect routes with low performance.
With these tools, when you graphically select the target of your analysis, you have the corresponding command that you can execute in a terminal below, which is quite valuable for getting familiar with the CLI. This should be your primary means of debugging in production environments.
Ingress controller / gateway
LinkerD does not offer a specific ingress controller or gateway, choosing instead to rely on existing products, by supporting a wide range of ingress controllers. The service mesh will consider pods from your ingress controller just like any other service mesh resource, allowing you to mesh your ingress controller in a straight-forward way.
Here in our KinD cluster, we will install a standard ingress controller: nginx.
We can then access to our voting application on https://localhost, but if we analyze into tap the trafic we can’t distinguish what are the requests from outside the cluster.
So we need to mesh our ingress controller:
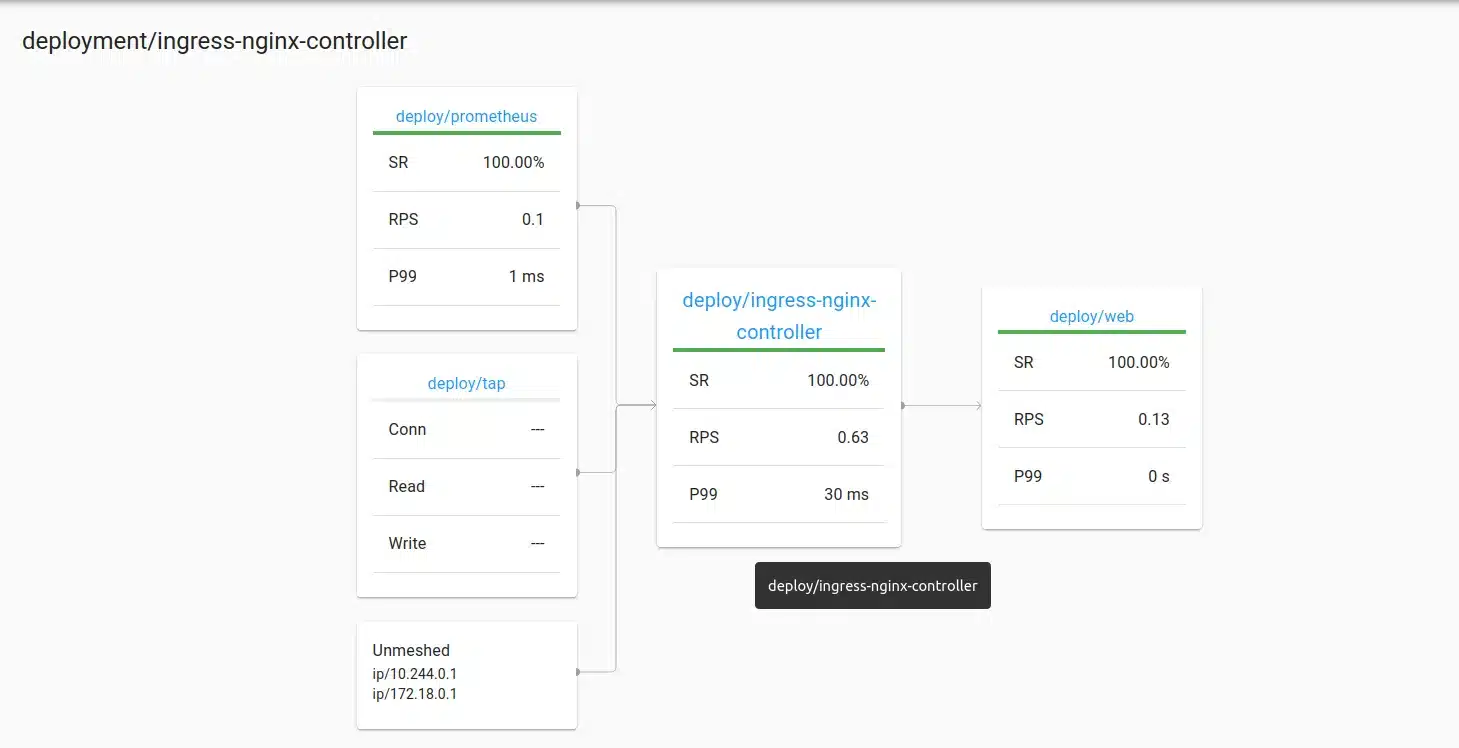
Now we can go back to our dashboard the ingress-controller inbounf requests, and see an ip "172.18.0.1)
This IP is ours in this network.
Why meshing our ingress controller is important? for instance to enforce that the mTLS is activated everywhere into our cluster, and check it
We start by extracting our pods ips, to not be confused with the probes that are executed in further analysis:
Then we use the tap command to check requests from and to our ingress controller:
linkerd viz tap -n ingress-nginx deploy/ingress-nginx-controller | grep 10.244.0.33 | grep 10.244.0.27
We refresh the page and check the output of our tap command, which is confirming that mTLS is enabled between our ingress controller and the pod (tls: true):
In conclusion, we therefore acknowledge that even though LinkerD has chosen not to specifically implement an ingress gateway, this decision is made to provide us the greatest flexibility in choosing our ingress controller without being intrusive. This point can be debatable (and should be discussed before selecting your service mesh) because, although ingress controllers are indeed supported, the lack of native features compared to other service meshes that offer an ingress gateway can be a painful point.
Indeed, while most features of an ingress gateway can be implemented using different rules once the gateway is meshed, enforcing behaviors is not straightforward (imagine a scenario where an incoming traffic rule is not in place to restrict, for example, which endpoints can be reached – in this case, all endpoints become reachable, and it is less straightforward to observe the behavior at the cluster’s entry point, as one must analyze the rules in place to get a complete view of what is happening).
With Istio for instance, the ingress gateway allows us to reach virtual services that enable direct use of traffic-splitting features, for instance. The analysis of routing rules remains simpler because we can directly observe virtual services, whereas with LinkerD, we would need to analyze many rules around the routes used.
We can see that the roadmap mentions an ingress gateway feature would be implemented in the future, based on existing functionality in the case of multi-cluster, which could be a foundation for the ingress gateway in a single-cluster scenario.
Routing and security rules
LinkerD provides security and routing rules.
For routing, it is now the object HTTPRoute (you can find other ways, but they seem to be deprecated).
For the network security and authorizations there are more objects :
AuthorizationPolicy
ServerAuthorization
MeshTLSAuthentication
NetworkAuthentication
All of them will provide you ways to setup security policies for services and routes.
Let’s take a quick example, where we create an authorization policy to forbid every direct access to our web-svc service from a pod into the cluster.
We will then authorizae only the ingress controller service account to access.
We adapt the following documentation to keep our exemple valid with emojivoto.
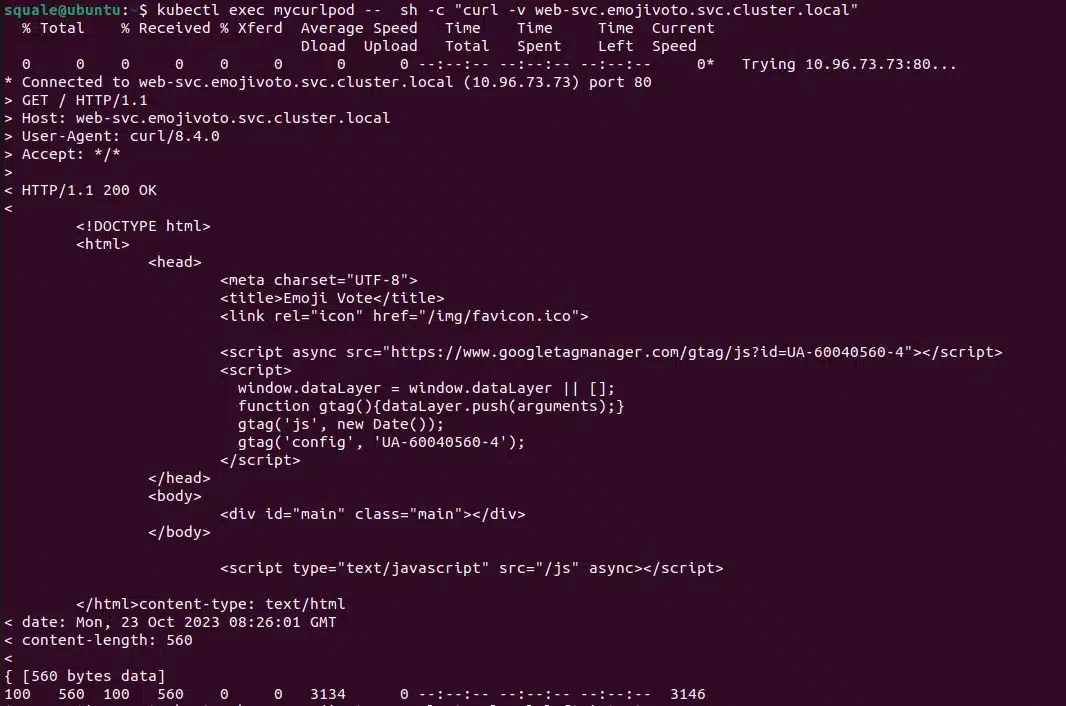
Before doing anything, let’s check that we can access to the service from any pod for now:
kubectl run mycurlpod --image=curlimages/curl -- sh -c "curl -v web-svc.emojivoto.svc.cluster.local && sleep infinity"
Answer from the web service is correct, there’s no error:
kubectl logs -f mycurlpod
Back to authorizations. We can list authorizations into our namespace by using :
linkerd viz authz -n emojivoto deploy/web
We can see there’s already some authorizations (these are the default ones) :
default : allow every not-authentified request
probe : allow not-authentified requests to access to probes
It is interesting to notify that the resources Server are the resource for the default:all-unauthenticated policies.
We will create a new Server on which we will apply the policy.
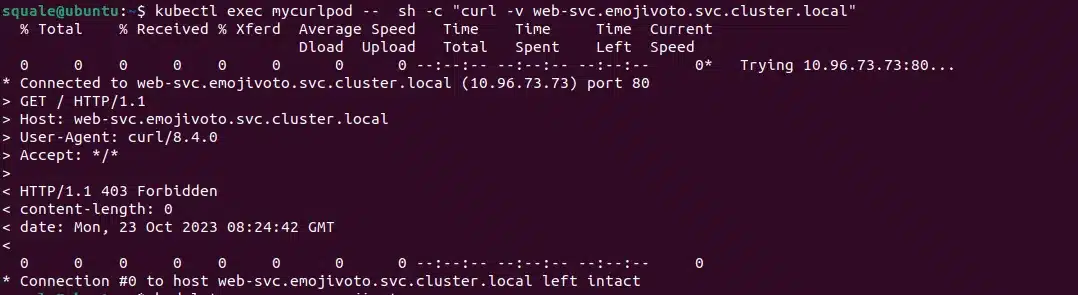
Now we should have an error if we call directly from our curl pod to the web service because it will not come from the ingress controller:
kubectl exec mycurlpod -- sh -c "curl -v web-svc.emojivoto.svc.cluster.local"
We have a 403 error code, and that is what was expected.
if we go through https://localhost the service will continue to answer, because we go there through the ingress controller (and so through the correct service account).
Authentification
LinkerD provides the following mecanism for Atuhorization:
ServerAuthorization we have just illustrated a use case of this permission. It allows you, after defining a resource called Server, to specify which clients can access it.
AuthorizationPolicy allows you to specify which clients can access a route or server, so it is more generic than the previous one.
MeshTLSAuthentication allows authorizing services through the mTLS (mutual Transport Layer Security) functionality provided by the service mesh. You define the identities used by the service and the identities that can access the service.
NetworkAuthentication allows you to restrict the CIDRs that can access a Server-type resource (which can be a set of pods with pod selectors), a namespace, or even a route. In fact, we can note that this is more of an implementation of permissions than authentication (this type of authentication being rather "weak," ultimately allowing you to implement fairly low-level network restrictions).
It’s worth mentioning that currently, it is not possible to natively perform JWT (JSON Web Token) authentication, for example (although there are ongoing discussions in related issues, and it will likely be implemented in the future).
Deployment modes
Tp keep our blog articles concise, we won’t go into the detailed implementation of each deployment mode, but you can refer to the documentation which is really complete.
The provided deployment modes with LinkerD are the following (refer to the documentation on trafic Shifting):
By the way, for some deployment use-cases (for instance the canari deployment with Flagger) we will have to use SMI provided adapter,
Maturity and community
As mentioned earlier, LinkerD is a pioneer in the realm of service meshes. Its declared goal is to remain simple in terms of installation and configuration. It sometimes offers fewer features than its competitors, but its maturity is well established.
The project has a large open-source community since it has been donated to the CNCF one year after its creation. There are various ways to engage with the community, including Slack, forums, and Twitter.
No-sidecar mode
For now this service mesh does not provide a no-sidecar mode, which we find a bit limiting compared to other service meshes like Istio. The ability to lighten the resources consumed by the service mesh is one of the advantages offered by alternatives that support architectures without sidecar containers, and this feature does not seem to be part of the current LinkerD roadmap.
Another advantage of an architecture without a sidecar is that it avoids the need to restart all pods when making changes that impact your workloads. While the sidecar model allows for a less "disruptive" application of configurations, enabling a more gradual rollout of features affecting all pods, this approach becomes very painful when dealing with hundreds or thousands of pods into a cluster.
Operability
As mentioned several times in this article, this service mesh aims to be simpler to install and use than other service meshes in the market. It remains relatively straightforward to operate, as the number of implementations to achieve the same result is kept minimal, ensuring consistency across different use cases within the same cluster.
The dashboarding feature is user-friendly, allowing you to quickly identify struggling services. You can easily check the latency for calls to a service and identify congested routes.
That being said, even though the simplicity of LinkerD makes adopting this service mesh less complicated, it’s advisable to provide training to operational teams during its implementation. After all, it’s still an additional technology for these teams to adopt.
Tooling
LinkerD CLI
The provided linkerd client can help you easily find configurations applied to your cluster and diagnose issues when something goes wrong. It also allows you to inject sidecar containers, as we discussed earlier, and quickly launch the dashboard.
linkerd -- help will provide you with a list of available commands, some of which are very useful when troubleshooting, particularly the diagnostics command. We won’t detail every command in this article, as they are well-documented and self-explanatory for guiding you through their usage.
Logging
If you encounter issues during the service mesh setup and suspect that the LinkerD configuration itself might be the cause, you should inspect the logs of the service mesh.
The stern tool can be very useful for reading all the logs from a namespace when the problem occurs, in our case, in the LinkerD system namespace.
To log all our service mesh pods, we will use the following command:
First and foremost, you can naturally use the native features and access the LinkerD dashboard. If you already have an observability stack such as Prometheus/Grafana, you can directly include the service mesh metrics in your Grafana instance, whether inside or outside your cluster (see the documentation).
Also, note that a Jaeger extension is available, allowing you to analyze your response times more commonly with this tracing tool, for instance.
Possibilité d’implémentation multi-clusters
This topic will be covered in a specific article dedicated to the implementation of a multi-cluster service mesh. Support for multi-cluster implementation is indeed present in LinkerD through the multi-cluster extension.
Conclusion
While LinkerD offers fewer features than some other service meshes, it remains a pioneer in the concept and aims to be the simplest to use. Just like in our previous articles, we haven’t delved into certain features (error injection, retries, etc.) for the sake of brevity. However, the documentation is quite clear, and you can easily explore the topic by following the examples provided.
It’s worth noting that even though LinkerD intentionally doesn’t offer a vast array of features, it has evolved to provide lighter and more intuitive implementations over time.
If you’re looking to implement LinkerD within your platform and require support, don’t hesitate to contact SoKube. We would be happy to assist you on this journey to implementing a service mesh.
To provide the best experiences, we use technologies such as cookies to store and/or access device information. Consenting to these technologies will allow us to process data such as browsing behavior or unique IDs on this site. Failure to consent or withdrawing consent may adversely affect certain features and functions.
Fonctionnel
Always active
Le stockage ou l’accès technique est strictement nécessaire dans la finalité d’intérêt légitime de permettre l’utilisation d’un service spécifique explicitement demandé par l’abonné ou l’utilisateur, ou dans le seul but d’effectuer la transmission d’une communication sur un réseau de communications électroniques.
Préférences
Le stockage ou l’accès technique est nécessaire dans la finalité d’intérêt légitime de stocker des préférences qui ne sont pas demandées par l’abonné ou l’utilisateur.
Statistiques
Le stockage ou l’accès technique qui est utilisé exclusivement à des fins statistiques.Le stockage ou l’accès technique qui est utilisé exclusivement dans des finalités statistiques anonymes. En l’absence d’une assignation à comparaître, d’une conformité volontaire de la part de votre fournisseur d’accès à internet ou d’enregistrements supplémentaires provenant d’une tierce partie, les informations stockées ou extraites à cette seule fin ne peuvent généralement pas être utilisées pour vous identifier.
Marketing
Le stockage ou l’accès technique est nécessaire pour créer des profils d’utilisateurs afin d’envoyer des publicités, ou pour suivre l’utilisateur sur un site web ou sur plusieurs sites web ayant des finalités marketing similaires.